3rd Party Performance
Third-party content is any content linked from your webpage over which you do not have direct control. First party content refers to content you either host yourself or have the ability to update and change, like JavaScript hosted on your servers, images on a separate image server, etc.
The amount of third-party content on websites is growing. While some verticals make more use of third-party content than others (ecommerce vs financial), the fact remains that our customers rely on data from third-party providers to run their businesses.
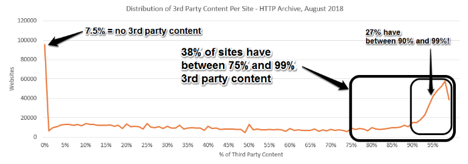
Recent research from HTTP Archive, conducted by Paul Calvano, shows that only 7.5% of websites have no 3rd party content and 38% of sites have between 75 and 99% of 3rd party content.
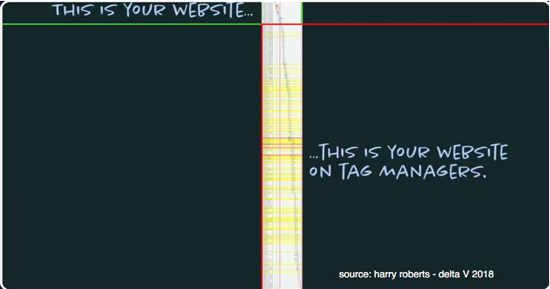
A frustration for developers is the fact that most third-party content is added by the business/marketing team through tag managers like Adobe’s Digital Tag Manager (DTM) or Google’s GTM. What they build in the dev/staging environment is often much different than what the end user actually receives.
Below is an example of the page resources on an e-commerce site. The resources below the line are all third-party content that were added by the tag manager.
Along with this additional content comes potential issues like security vulnerabilities, additional network delays, and blocking content that impact the loading of first-party content. It’s important that we help our customers realize the potential impact of third-party content and provide insight that will help them make decisions on which providers are right for their business. Here are a few steps that can help with this process:
Identify
The first step in resolving third-party performance issues is to identify the third-parties. There are several tools that can be used to identify third-party content on a site.
WebPageTest
This performance swiss army knife can show performance data by domain. Although it doesn’t explicitly break out first vs third-party domains, you get a clear picture of the impact of a domain in terms of number of requests and bytes served.

Request Map Generator
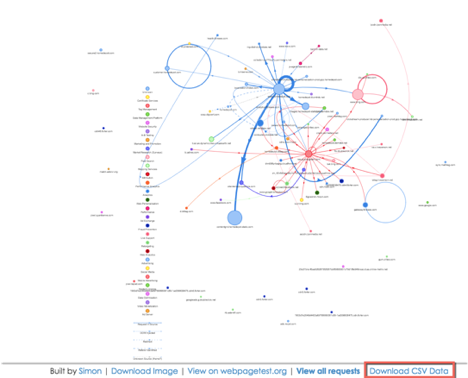
One of my favorite tools is Request Map Generator, created by our own Simon Hearne. This visual tool provides a great place to start looking at 3rd party contributors. It not only shows the direct 3rd party calls, but the subsequent calls made by those 3rd parties, exposing the tangled web of calls that users are subjected to.
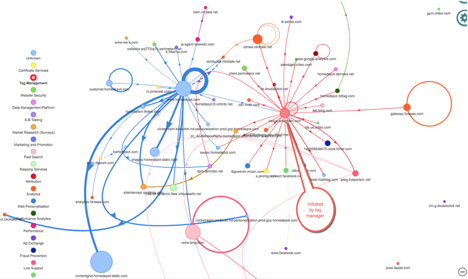
The nodes on the map represent domains. The size of the node represents the percentage of bytes transmitted from that domain. The distance between the nodes represents the time to first byte (TTFB). The thickness of the lines between the nodes represents the number of requests between the domains. Domains are color coded based by their category. It’s especially useful to see all the domains initiated by the tag manager (ensighten in the above example).
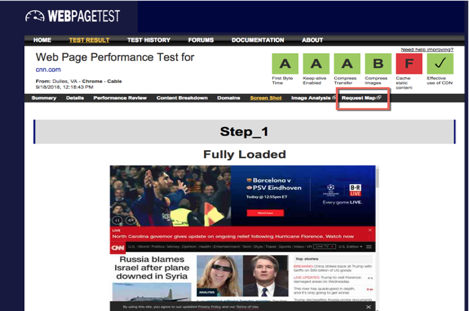
The request map can also be initiated directly from WebPageTest:
Rigor
The recent partnership between Akamai and Rigor makes Rigor’s synthetic monitoring tool available to us. The monitoring component of Rigor includes a domain section that trends domain performance over time, making it easy to recognize changes in the performance of any third-party domain.
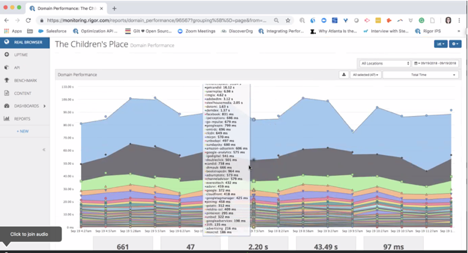
The optimization component of Rigor provides insights and recommendations for improving site performance. One of its features is a request map that, like requestmap.webperf.tools, visualizes the flow of calls on a page. It also provides an option for viewing just third-party content and allows the user to drill into a domain with the click of the mouse.
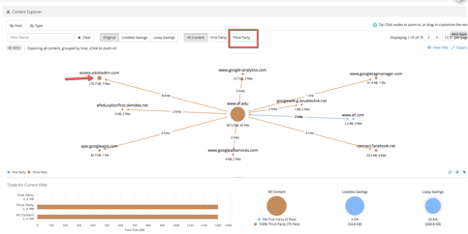
Clicking into assets.adobedtm.com shows the calls made by this domain:
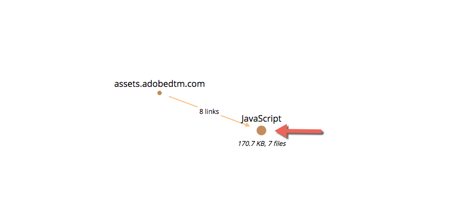
Clicking into the JavaScript layer shows the JS calls made by DTM:

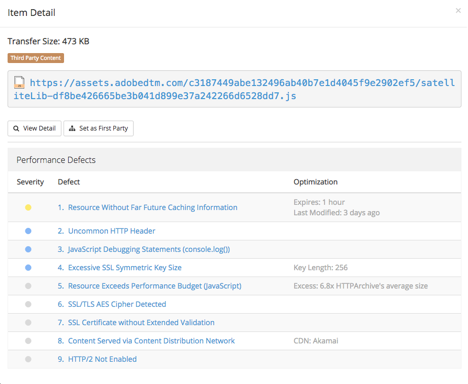
And clicking into any JS call shows the results of the audit done on the js that includes many useful recommendations to improve performance and security:
mPulse
Real user monitoring (RUM) tools like mPulse provide many benefits over synthetic tools like WebPageTest and Rigor. mPulse captures performance information for all real users and real devices, rather than the single synthetic user running from a datacenter. One of the new capabilities of mPulse provides insight into third-party performance. The new aggregate waterfall trends domain and resource performance over time.
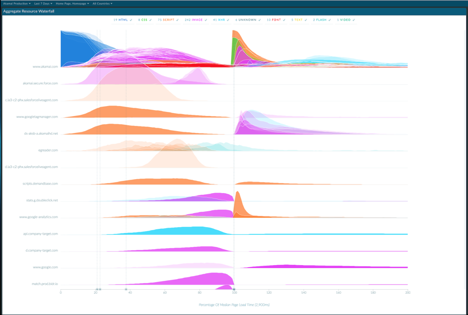
Each row of the graph shows resource performance from a domain over the time range selected in the dashboard. Resources are color coded by resource type.
Audit
Once we identify the third-party components of a site, it’s important to audit these third-parties for issues that could contribute to poor performance and security violations. Areas of concern include:
Security
There are many recent high-profile security outages in high traffic websites. Many of these are a result of vulnerabilities in third party content. According to a recent study from Soha System, nearly two-thirds of all data breaches (63%) result not from direct outside penetration of an organization’s’ own network, but from attacks launched on or through third-party vendors. This is the case for recent breaches at Equifax, Target and Yahoo.
One of the best ways to ensure secure third-parties is to require that they have secure origins. Modern browsers will detect the use of non-secure resources and provide the user with a mixed content warning.
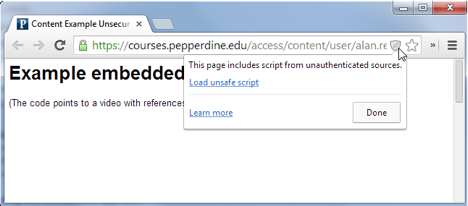
In addition to the obvious security implications, these warning messages raise doubt in the minds of customers and erode trust in the brand.
A second method that can be used to guard against malicious third-parties is a Content Security Policy (CSP). CSP is a web standard designed to prevent cross-site scripting (XSS), clickjacking and other code injection attacks resulting from execution of malicious content on the trusted page. CSP provides a standard method for developers to declare approved origins of content that browsers should be allowed to load. The standard covers resource types such as JavaScript, CSS, fonts, images, video files, etc.
For example, a developer could specify that any content type is safe to load from their own site, that images may be loaded from any domain and that JavaScript libraries and script may only be loaded from a separate trusted domain:
default-src ‘self’; img-src *; script-src https://userscripts.trusted.com
As mentioned above, Rigor also has audit capabilities that identify security vulnerabilities.
SPoF
A third-party becomes a single point of failure (SPoF) when its execution prevents other resources from loading on the page. Put another way, “when they go down, you go down”. Here’s an example from sky.com during a recent outage of Adobe Tag Manager.
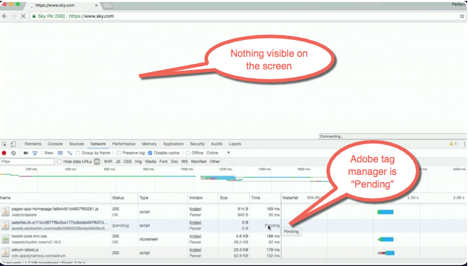
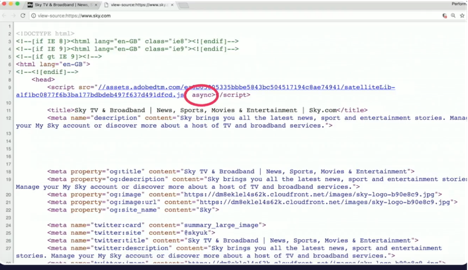
An examination of the source shows that the tag manager is a synchronous script in the head section of the page (line 9).
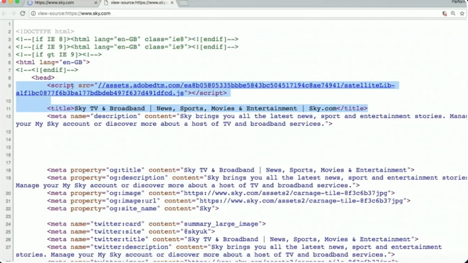
Because of its location on the page and is blocking nature, the DTM outage causes sky.com to appear to be offline as well. The default timeout in Chrome is 80 seconds. So, the page will load after the timeout value expires. But who’s going to wait 80 seconds for a page to load?
A new feature in Akamai’s Script Manager tracks problematic third party scripts and automatically defers any scripts that exceed the threshold set for real users (Ion).
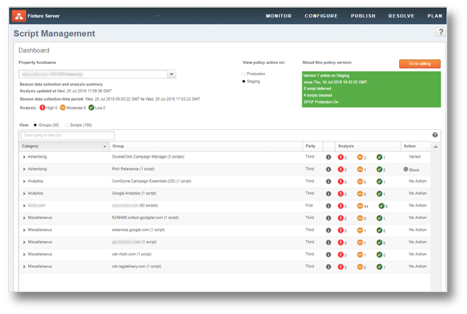
Use the Script Management Policy Tester Chrome plugin to preview how your page would load if a third party script were blocked or deferred before taking action on it.
Performance
It’s often useful to first understand the overall impact of third-party performance on the site. There are several methods that can be employed to understand the impact of third-parties on page performance. Below are some of the different options.
1 – Request Map and WebPageTest
Go back to the request map and download the CSV file that contains the domain name, origin, category, and other performance metrics.
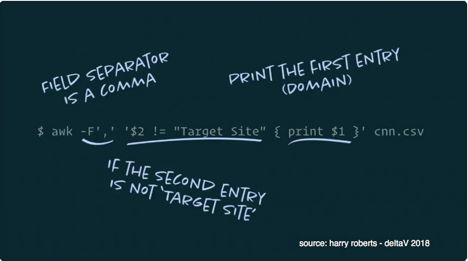
Next, we can extract the third-party domain names from the CSV file
We can now use the list of third-party domains in the Advanced section of WebPageTest to block requests to these domains in our next test.
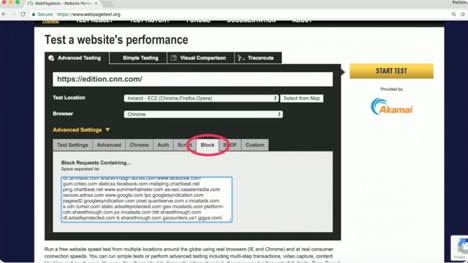
Which will allow us to compare performance with third-party domains and without them.
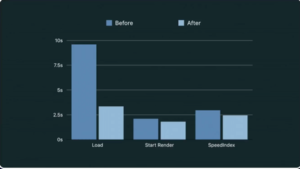
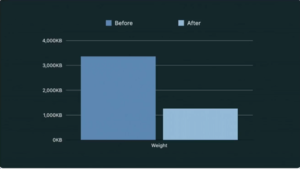
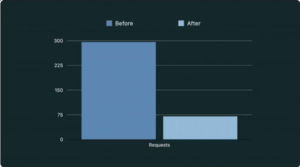
2 – WebPageTest Scripting
The example above required some manual work to extract the 3rd Party domains you want to block. WebPageTest also has a scripting capability with an extensive set of commands that can applied. One of these commands is blockDomainsExcept. As its name implies, this will cause WebPageTest to block requests to all domains except those specified in the list.
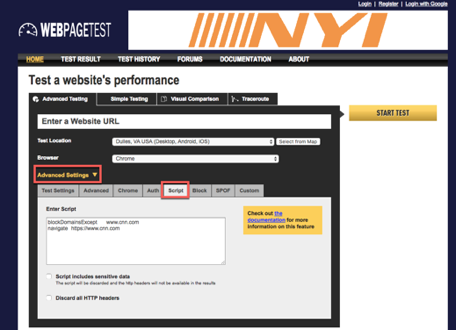
Other useful script commands are:
block – followed by a space separated list of substrings
blockDomains – followed by a space separated list of domains to block
The following script is an example how to run this for CNN
BlockDomainsExcept www.cnn.com cdn.cnn.com
navigate www.cnn.com
3 – Image Manager Test Tool
Michael Gooding created a tool that uses WebPageTest to run two tests – one with Image Manager on and the other with Image Manager off. https://origin-im.web.akamaidemo.com/wpt.php
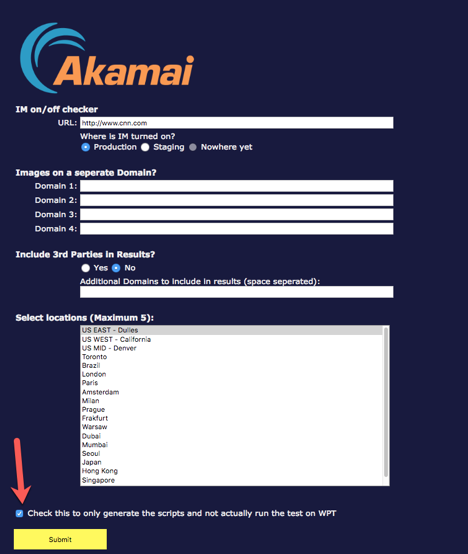
Checking the box at the bottom of the page will cause the tool to generate a WebPageTest script rather than running the test.
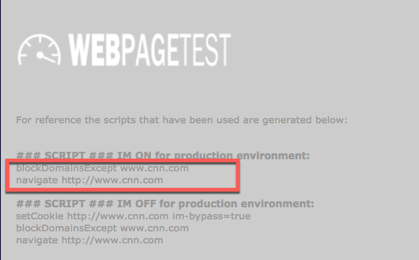
The resulting script can then be plugged into WebPageTest as described in step 2 above.
4 – Rigor
As mentioned above, Rigor also has audit capabilities that identify performance vulnerabilities.
Runtime Cost
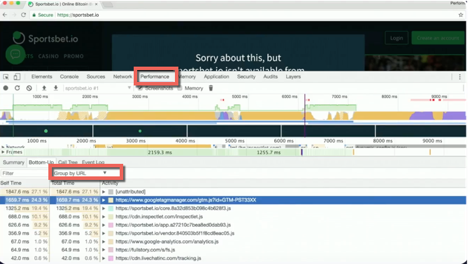
Another useful tool for checking runtime performance is Chrome DevTools. The Performance tab allows us to run a performance profile. Next select Bottom-Up on the Summary panel below and change the grouping to Group By Domain. This will show the domains with the largest runtime. Next change the grouping to Group By URL for a focus on the resources with the largest runtime.
Understand Impact
It’s one thing to identify a poor performing domain or resource. But it’s quite another to understand the impact that poor performance has on the user experience. Walmart recognizes the importance of speed to their business results. They acknowledged that every 100ms improvement results in up to a 1% revenue increase. That’s an additional $230m per year for every 100 milliseconds.
mPulse does a great job of showing the relationship between speed and user engagement. Using the predictive What-If Dashboard, users can understand the benefit of a faster load time.
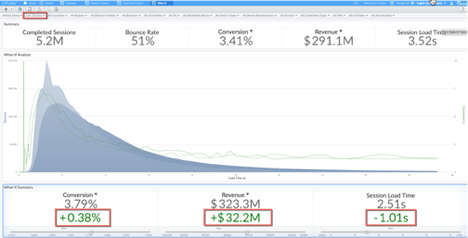
This example predicts that a 1 second reduction in load time would result in an increase in conversion rate of .38%, resulting in an increase in revenue of $32.2M every 30 days.
A new feature of mPulse extends the What-If capability to third-party resources.
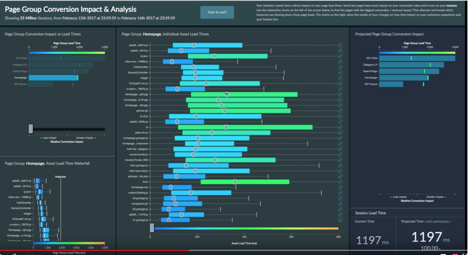
The top left widget shows the load time and conversion impact by page group. The bottom left widget shows the resource waterfall for the selected page group. The middle widget allows the user to remove or reduce the load time of resources on the selected page group. Both the waterfall widget (lower right) and conversion impact widget (right pane) are updated with projections of the impact of the resource changes.
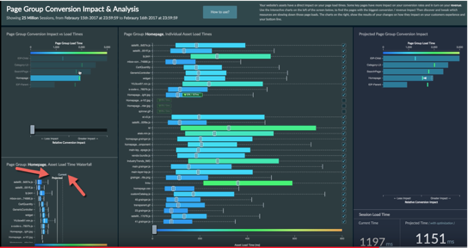
This powerful new capability allows us to isolate the exact third-party resources that will have the most impact on the customers bottom line.
Mitigate
The tools mentioned above provide a great start to identifying and resolving third-party performance issues. It’s also worth reviewing some best practices as it relates to using third-party resources.
Self Hosting
As much as possible, host third-party assets from the first party origin or CDN. This results in reduced network negotiation (DNS, TCP, TLS) and a consistent backend time from a controlled back-end infrastructure. It also allows you to dictate your own caching strategy, including preloading.
Load Asynchronously
Eliminate single points of failure by loading all third-party scripts asynchronously. Most providers offer an async loader option. Be suspicious of any provider that doesn’t. The outage example reviewed above could have been avoided by loading the tag manager asynchronously.
Preconnect Frequently Used Providers
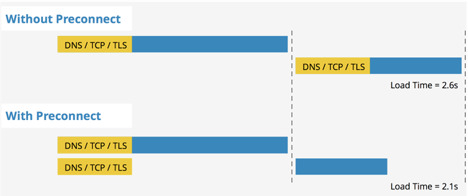
Preconnect allows the browser to setup early connections before an HTTP request is sent to the server. This includes DNS lookups, TLS negotiations, and TCP handshaking. This in turn eliminates round trip latency and saves time for users.
Secure Origins
Only use content from secure origins.
CSP
Use Content Security Policy to limit the origins that can interact with your site.
Your Content First
As much as possible, don’t run your tag manager before your own content. As we say with the sky.com example, if their content loaded before DTM the user would at least have had some visual indication that the page was loading prior to the delay from the DTM outage.
Restraint
In today’s world it’s nearly impossible to not use third-party content of some time. But try to get by with as little third-party content for as long as possible. If you don’t need it, don’t use it. Noted performance author and speaker Tim Kadlec says, “Everything we put on our site has a value, but how often do you measure the cost?” The tools and techniques recommended above allow us to do just that.