Get Detailed Performance Resource Data in mPulse
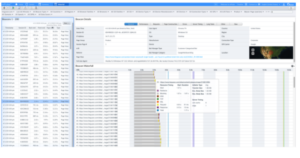
mPulse captures detailed performance information about each resource on a page. This information is extremely useful when trying to analyze page performance issues, as shown in the waterfall dashboard below.

Note the detailed performance data captured for the selected image on the product page, including color coding to show how much time is spent in redirects, blocking (grey), dns, etc. Also note detail on the size of the resource, including transfer size.
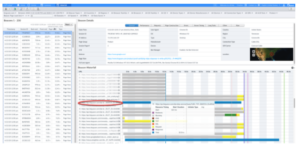
However, this useful detailed performance data is not available for all resources on the page, as shown below.

mPulse is only reporting the total time of the download of this resource from api.ferguson.com. So why do some resources contain detailed performance data and others summary data? The answer is found in Cross Origin Resource Sharing (CORS).
mPulse collects resource timing data from the W3C Resource Timing API, a standard JavaScript API that is implemented in modern web browsers. These modern browsers also enforce security limitations that say that if your site uses multiple domains (such as ‘www’ and ‘api’ in the above examples) or has content served from both secure and non-secure servers, you will only be able to get resource-level details for requests from the same server/domain that served the base document request (www in this case).
To get component-level details for resources served from a domain other than the domain of the base HTML page, you’ll need to add headers to allow this capability. Specifically, you should add the following HTTP header to all requests:
Timing-Allow-Origin = “Timing-Allow-Origin” “:” origin-list-or-null | “*”
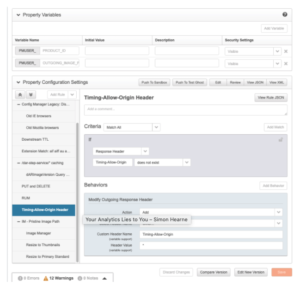
You can add this header in the Akamai config as shown below:

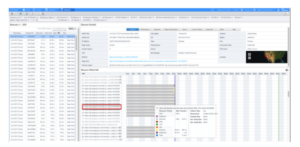
Once enabled, you will be able to see detailed performance data for resources from domains with the header added.

Great mPulse dashboards to visualize this data include:
- Waterfall
- Aggregate Waterfall
- Resource Treemap
To get detailed performance data for resources from domains that you don’t control, like 3rd party resources, you’ll need to get those providers to add this header to their resources.
mPulse is a great tool to use when performing detailed performance analysis. For example, we use it to validate the effectiveness of Image Manager and its ability to reduce the size of image resources. However, if these resources are coming from a domain other than the main domain (i.e. coming from a different image domain), mPulse will not be able to capture and report on detailed image performance – unless Time-Allow-Origin is enabled.